
X-ray identification of galaxy cluster
- Using a dedicated source detection and characterization algorithm optimized for extended sources, we detect 944 clusters with X-ray data from the ROSAT All-Sky Survey data, named as RXGCC catalog (Xu ea. 2018, 2022). In addition, we detect 141 clusters with XMM-SEVRS data, named as XVXGC catalog (Xu ea. 2024b).
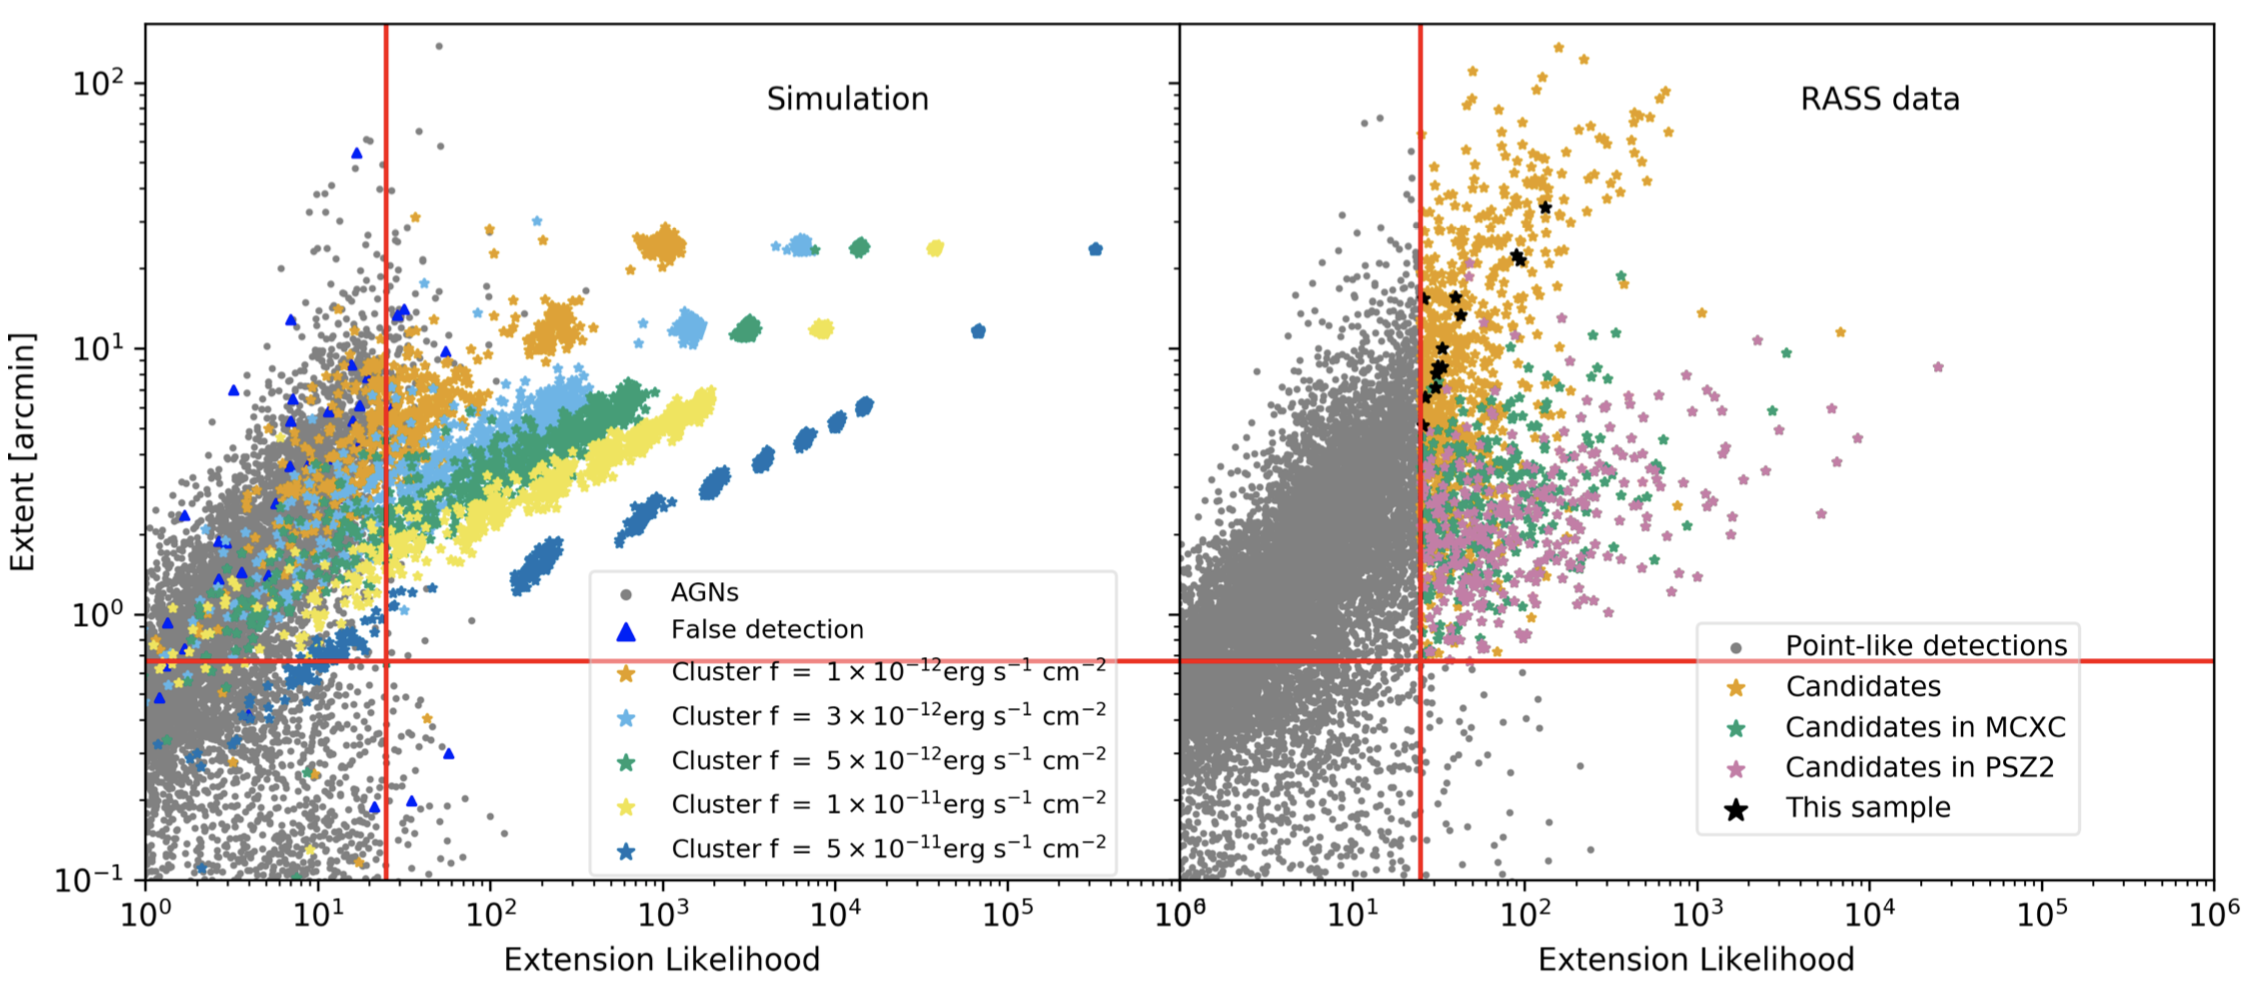
Fig. Selection criteria for extended sources. The selection is performed in the extension likelihood - extent plane.
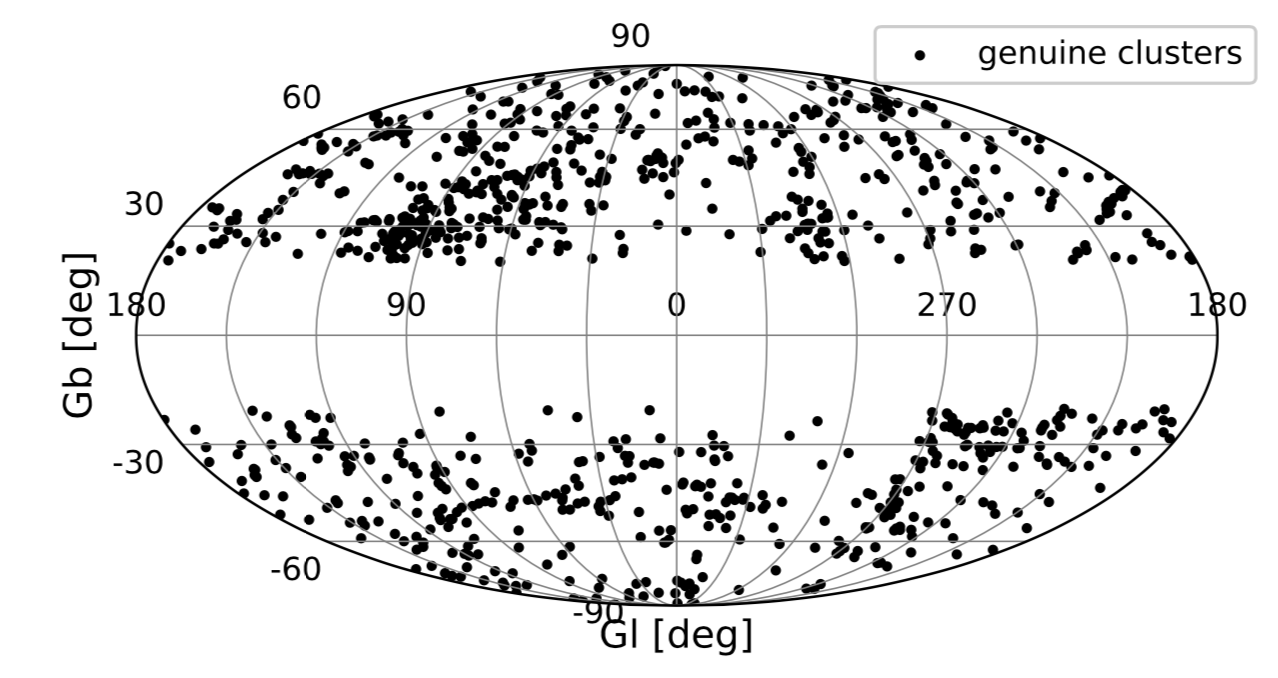
Fig. 944 RXGCC clusters detected with the X-ray data from ROSAT All-Sky Survey in [0.5-2.0] keV.
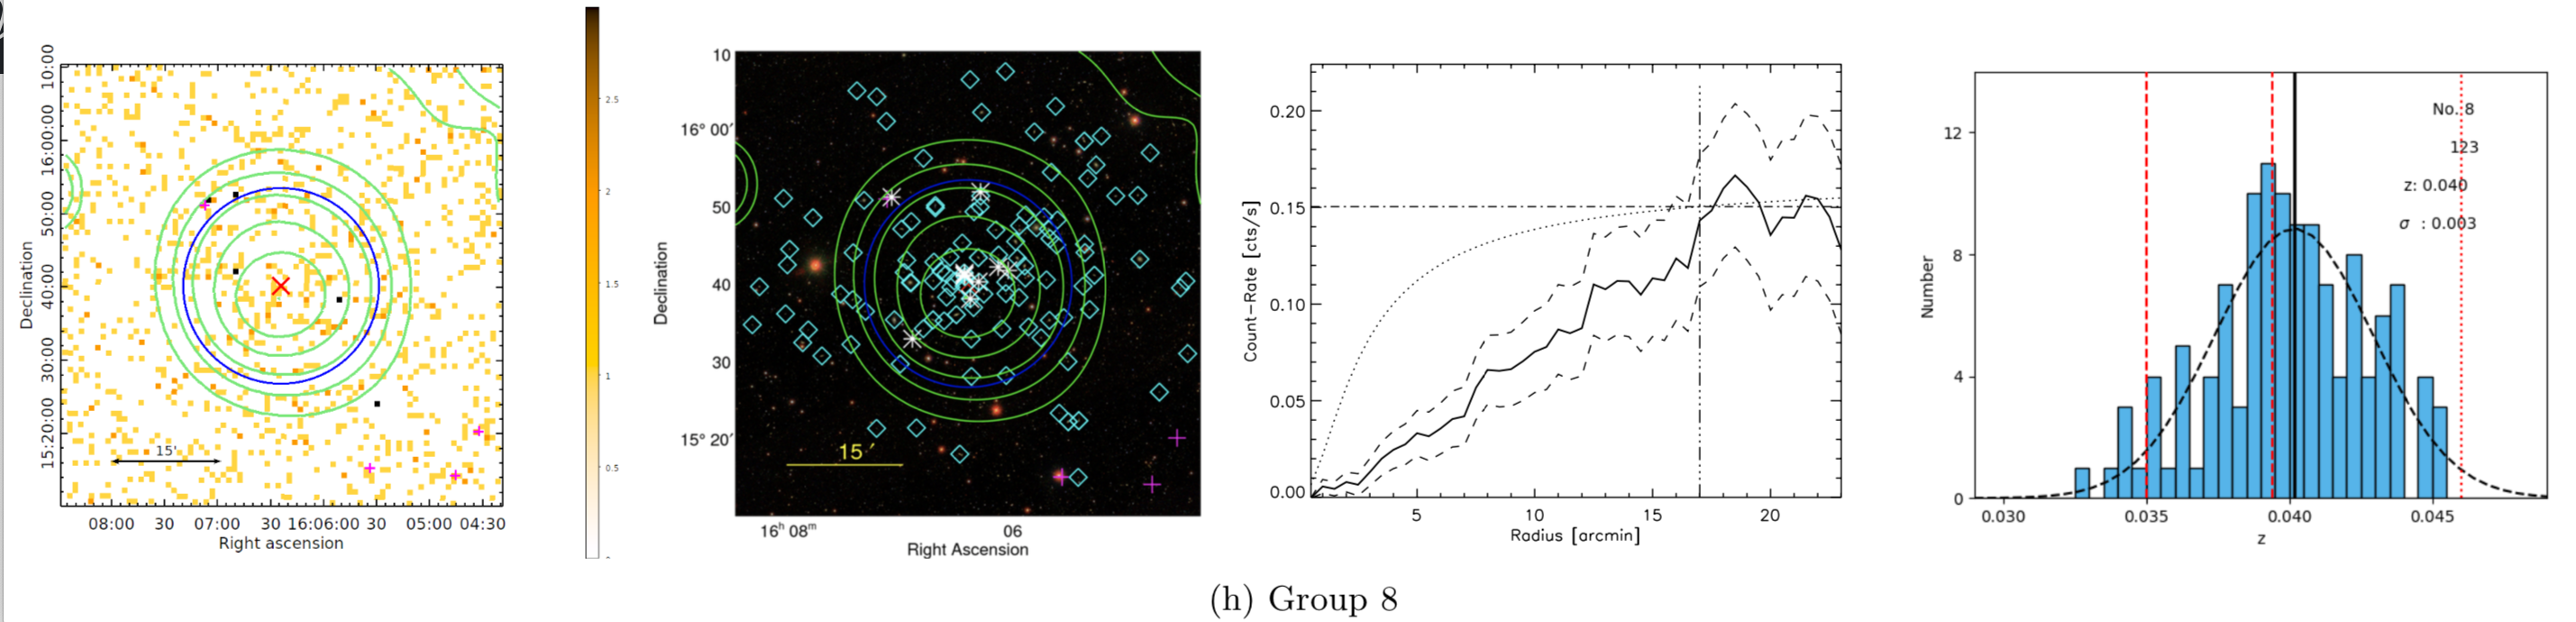
Fig. A RXGCC cluster as an example. RASS photon images (left), optical images, integrated count rates profiles, and spectroscopic redshift histograms (right) for the galaxy groups in our pilot sample. The optical images are from SDSS (composed of g, r, i bands).
gglens of massive halos
- We report the measurement of halo c-M relation with galaxy-galaxy lensing method, using shear catalog of the Dark Energy Camera Legacy Survey (DECaLS) Data Release 8, which covers a sky area of 9500 deg2. The foreground lenses are selected from redMaPPer, LOWZ, and CMASS catalogs. We fit the measured c-M relation, and find an upturn is favored over a simple power-law model. Our measurement provides important information for the recent argument of massive cluster formation process. (Xu ea. 2021)</br>
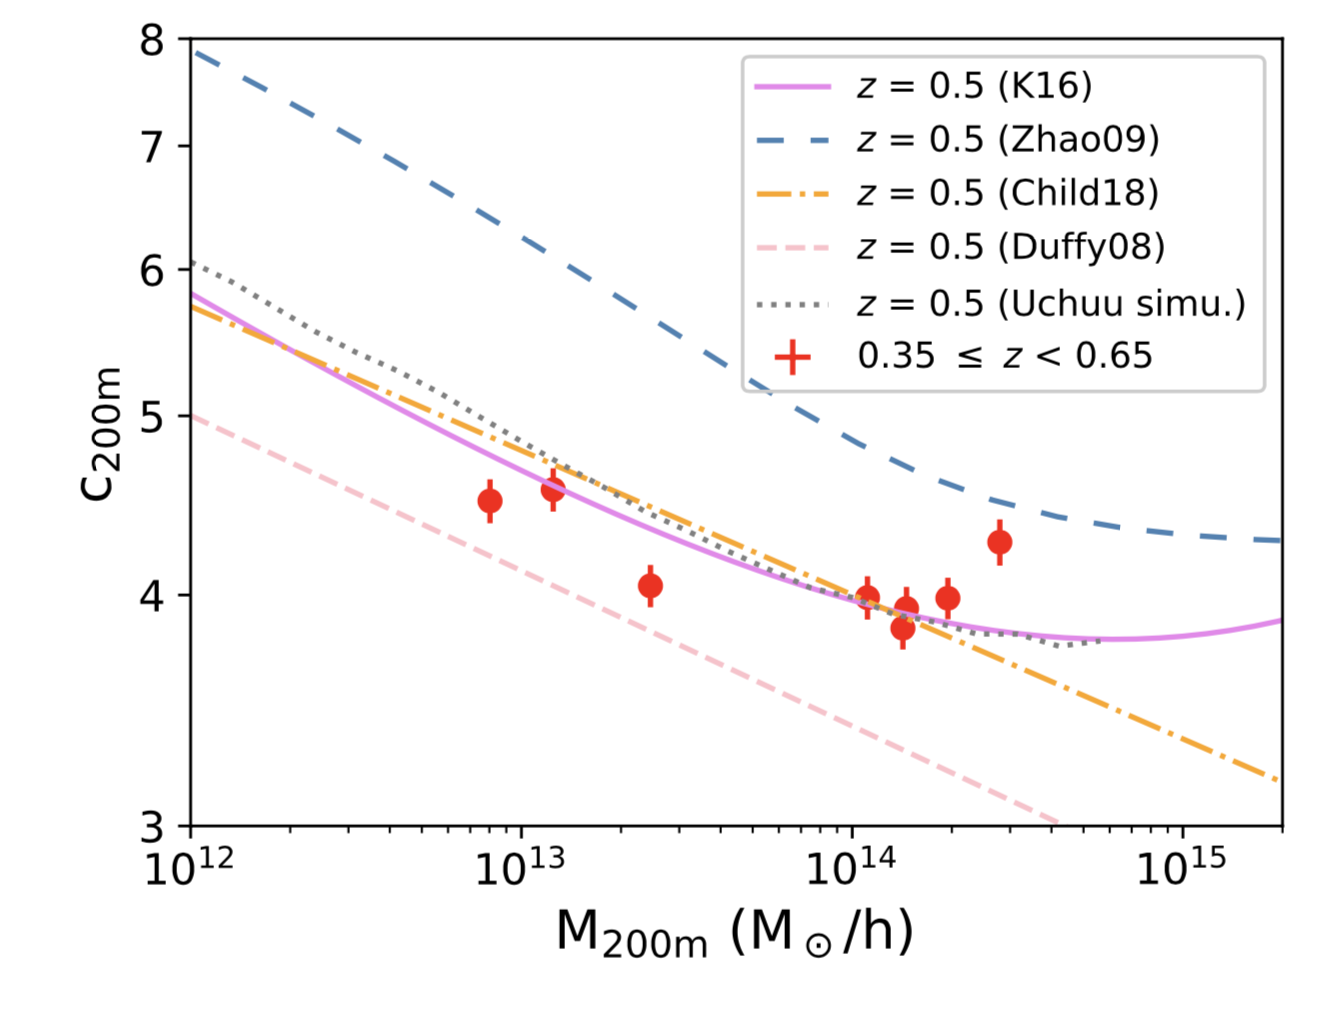
Fig. The stacked signal and model of the weak lensing of clusters. We detect the upturn of the mass-concentration relation predicted by Klypin ea. 2016.
- We also made the systematic measurement of the splashback radius for halos covering the largest mass range and largest redshift range, and find a consistent result with the simulation. (Xu ea. 2024a)</br>
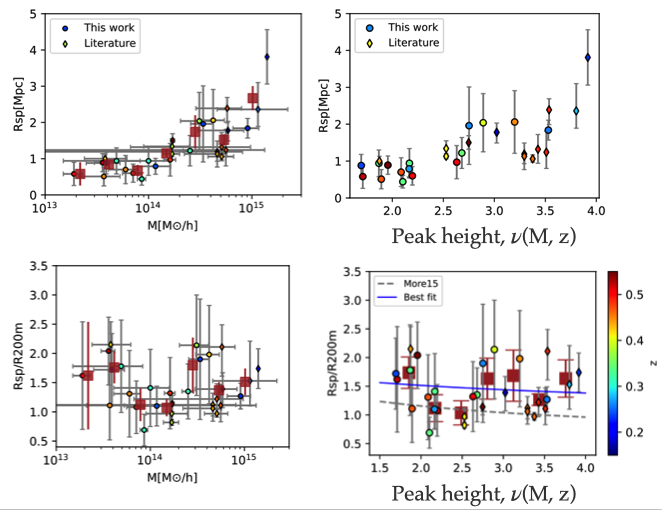
Fig. The measured splashback radius increases with the halo mass, and peak height. But this tendancy is less obvious for the splashback radius normalized by R200.
Optical identification galaxy clusters
- We present an efficient method for detecting galaxy clusters by combining the WISE data with SuperCOSMOS and 2MASS data. After performing star-galaxy separation, we calculate the number of companion galaxies around the galaxies with photometric redshifts previously estimated by the SuperCOSMOS, 2MASS and WISE data. A scaled richness Rscal >= 30 is set as a criterion to identify clusters. From a sky area of 275 deg2 of the Sloan Digital Sky Survey Stripe 82 region, we identify 302 clusters in the redshift range of 0.1-0.35, 247 (82%) of which are previously known SDSS clusters. (Xu ea. 2014)</br>
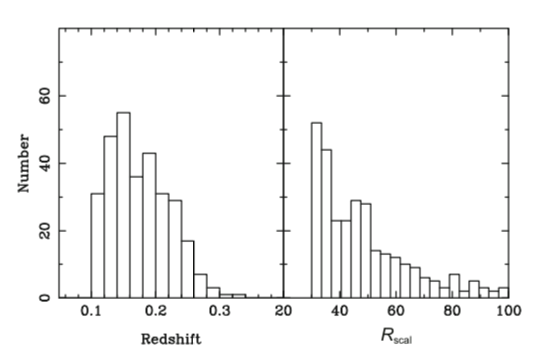
Fig. Distributions of redshift and scaled richness for the 302 identified clusters.
X-ray spectra analysis of AGN
- We report the detection of Kα lines of neutral Si, S, Ar, Ca, Cr, and Mn, along with the prominent Fe Kα, Fe Kβ, and Ni Kα lines, from the deep Chandra observation of the low-luminosity Compton-thick AGN in M51. The hard X-ray continuum of M51 from Chandra and NuSTAR confirms the Compton-thick nature of the nucleus of M51. (Xu ea. 2015)</br>
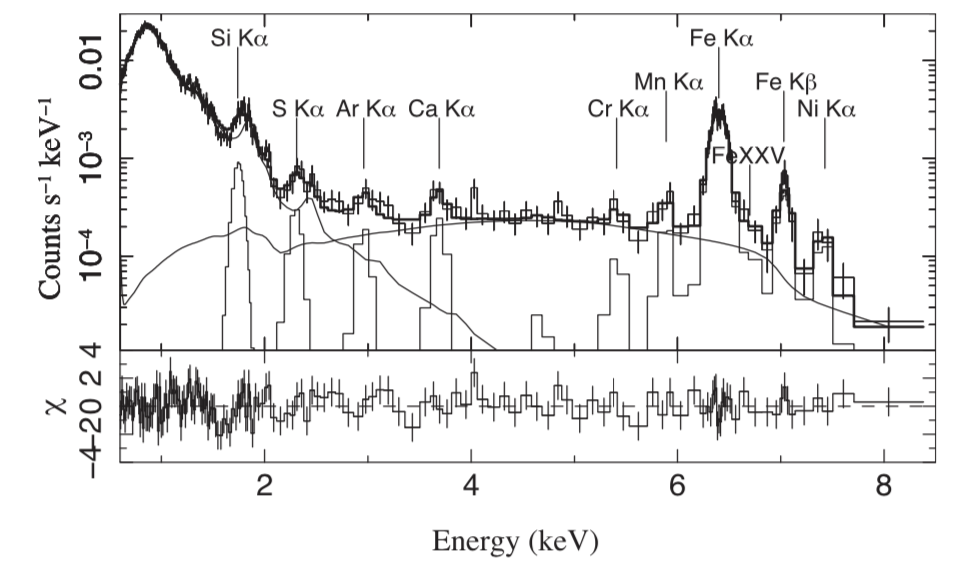
Fig. The model of Vapec+MYTorus+Gaussians fitted to the Chandra spectrum of the nucleus of M51.